The best soil monitoring tool isn’t the most advanced; it’s the one that provides the exact data resolution your specific agronomic question demands.
- Wireless sensors excel at high-frequency temporal data (answering when to act) for tasks like irrigation scheduling.
- Handheld probes are unmatched for high-density spatial mapping (answering where to act) to define management zones or locate compaction.
Recommendation: Define your primary challenge first—be it irrigation timing, VRI mapping, or compaction prevention—to determine whether real-time logging or periodic manual checks offers the superior return on investment.
The decision to invest in soil monitoring technology often presents a stark choice: embrace the continuous data stream of a wireless sensor network or rely on the targeted measurements of handheld probes. Many comparisons focus on the obvious trade-offs of cost versus data frequency, leading to the simple conclusion that sensors are for large, high-value operations and probes are for everyone else. This perspective, however, misses the fundamental point of precision agriculture.
The real question isn’t about which technology is “better,” but which one provides the right data resolution—in both time and space—to answer your most critical agronomic questions. A wireless sensor tells you what’s happening at a single point, minute by minute. A handheld probe, like a penetrometer, tells you what’s happening across an entire field, but only at the moment you take the reading. The optimal choice is therefore not a technological one, but a strategic one, dictated entirely by the operational problem you need to solve.
This guide moves beyond a simple pros-and-cons list. We will deconstruct the decision-making process from a soil technologist’s perspective, framing each tool within the context of the specific job it is designed to do. By understanding the distinct value of spatial versus temporal data, you can make an instrumented decision that aligns your investment with tangible agronomic outcomes, from optimizing water use to preventing yield-killing soil compaction.
To navigate this complex decision, we will explore the foundational role of soil mapping, the nuances of interpreting sensor data for specific tasks, the true total cost of ownership, and the critical importance of integrating all data sources for a holistic view of your field’s health.
Summary: Wireless Soil Sensors vs. Handheld Probes: A Strategic Comparison
- Why Soil EC Mapping is the Foundation of Precision Management?
- How to Read Soil Dielectric Sensors for Irrigation Timing?
- Real-Time Logging or Weekly Checks: Is the Data Worth the Cost?
- The Installation Mistake That Creates Air Gaps Around Sensors
- When is the Soil Dry Enough for Heavy Machinery Traffic?
- How to Map VRI Zones Based on Soil Water Holding Capacity?
- How to Use a Penetrometer to Map Field Compaction Zones?
- How to Interpret Soil Tests for Precision Fertilization?
Why Soil EC Mapping is the Foundation of Precision Management?
Before any sensor is installed or probe is pushed into the ground, understanding the inherent variability of your field is paramount. Electrical Conductivity (EC) mapping provides this foundational layer. EC is a measure of how well the soil conducts electricity, which is directly influenced by properties like soil texture (sand, silt, clay content), salinity, and water-holding capacity. It effectively creates a high-resolution “fingerprint” of your field’s productive potential, revealing distinct management zones that a single soil sample or sensor could never identify.
This initial map of spatial variability is the starting point for any precision strategy. It dictates where to place expensive wireless sensors for representative monitoring and where to conduct targeted handheld probe measurements. Without it, you risk placing a sensor in an anomalous zone, leading to irrigation or fertilization decisions based on data that doesn’t reflect the majority of the field. An EC map highlights areas of sandy, low-holding-capacity soil versus heavier clay zones, allowing you to tailor management practices accordingly.
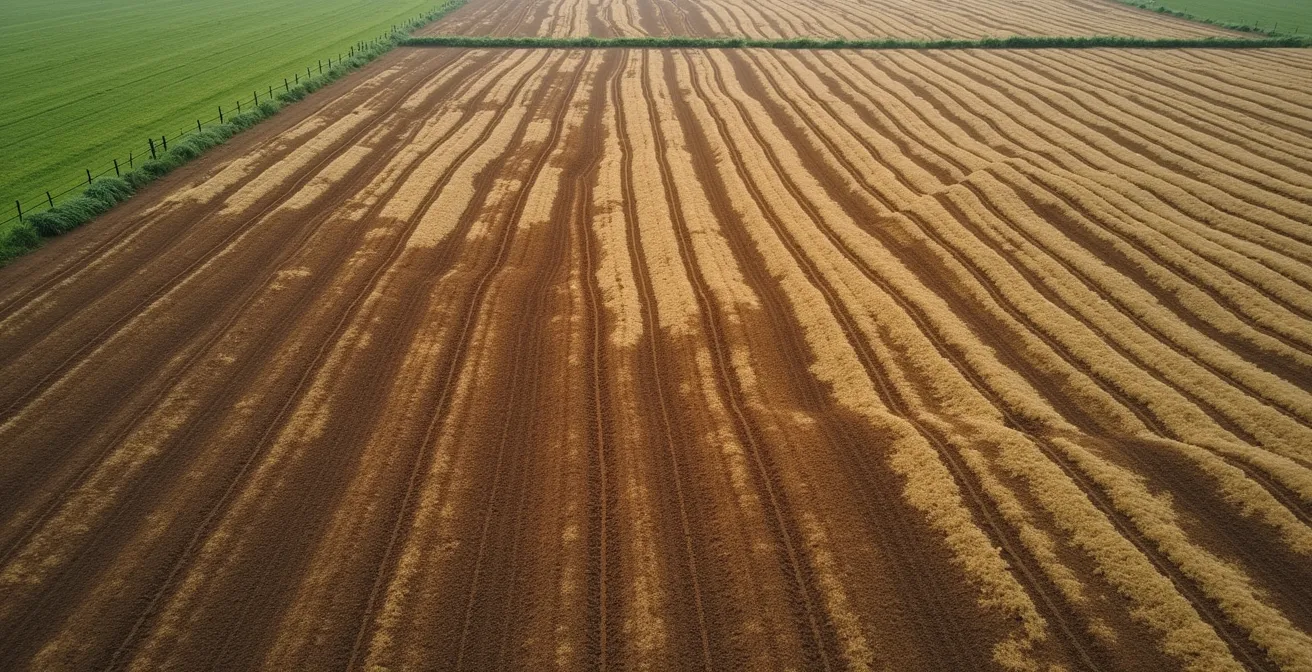
This visual representation of soil differences is not just a pretty picture; it is the strategic blueprint for resource allocation. It informs Variable Rate Irrigation (VRI) prescriptions, guides targeted soil sampling, and ultimately ensures that any subsequent data collection—whether real-time or manual—is done with purpose and context. Ignoring this step is like navigating without a map; you might collect data, but you won’t know what it truly represents in the broader landscape of your field.
How to Read Soil Dielectric Sensors for Irrigation Timing?
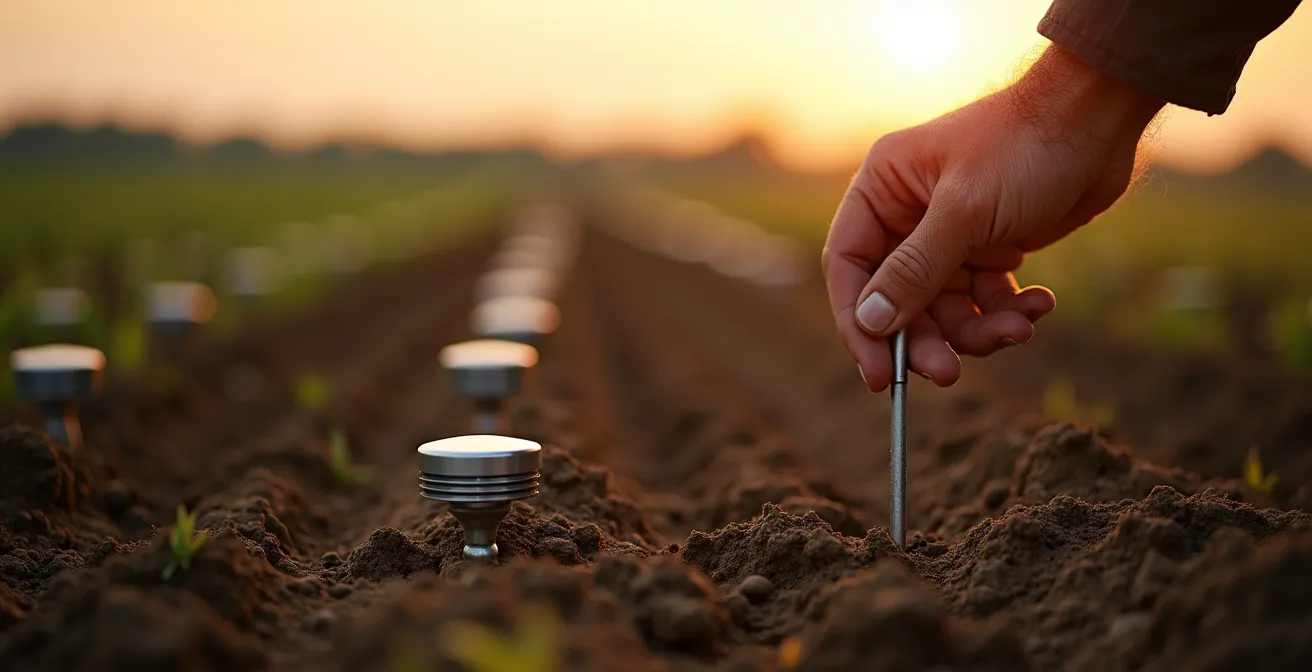
Once you’ve identified representative locations using an EC map, the role of a wireless sensor becomes clear: to monitor changes over time. For irrigation, dielectric sensors are the tool of choice. These instruments don’t measure water directly; instead, they measure the soil’s dielectric constant, or permittivity, which is a property that changes drastically with water content. The sensor sends an electrical pulse and measures the response, which is then converted into a Volumetric Water Content (VWC) reading—the volume of water in a given volume of soil.
However, a raw VWC number is meaningless without context. The key is to establish operational thresholds specific to your crop and soil type. This involves identifying two critical points: the Field Capacity (FC), the maximum amount of water the soil can hold after drainage, and the Management Allowable Depletion (MAD), the point at which plant stress begins. Irrigation should be triggered just before the soil reaches the MAD level. A Danish organic farm, Godis Grønt, leverages this principle by using real-time sensors to receive smartphone notifications, allowing them to irrigate at the precise moment it’s needed, optimizing water use in both fields and greenhouses.
Reading these sensors is less about looking at a single number and more about watching a trend. A steep drop in VWC on a hot day indicates high crop water use, while a flat line after a rain event might show poor infiltration. By placing sensors at multiple depths in the root zone (e.g., 10cm, 20cm, 30cm), you can see where the plant is drawing water from and ensure irrigation is refilling the entire profile without causing waterlogging or nutrient leaching past the roots. This temporal resolution is something a handheld probe, used weekly, simply cannot provide.
Real-Time Logging or Weekly Checks: Is the Data Worth the Cost?
The primary objection to wireless sensor networks is often the initial hardware cost, which seems prohibitive compared to a one-time purchase of a handheld probe. However, this view ignores the largest and most recurring expense in manual monitoring: labor. A comprehensive analysis of the Total Cost of Ownership (TCO) reveals a different financial picture. While handheld probes have a low entry cost, the accumulated labor for weekly field-wide checks quickly eclipses the initial investment in a wireless system.
The true value of real-time data is unlocked when it prevents a single costly mistake. Missing an irrigation cycle due to weekly-only data can cause irreversible yield loss, while an unnecessary irrigation wastes water, energy, and can lead to nutrient leaching. Furthermore, research indicates that farmers using sensor-based irrigation report soil health improvements in nearly 40% of monitored agricultural fields. The longevity of modern systems also factors into the TCO; some modern wireless soil sensors can achieve up to 20 years of maintenance-free operation, making them a long-term capital investment rather than a recurring operational cost.
The following table, based on recent analysis, breaks down the comparative costs over a five-year period, illustrating how labor drastically shifts the financial balance.
| Cost Category | Wireless Network (10 sensors) | Handheld System |
|---|---|---|
| Initial Hardware | $2,000-5,000 | $200-800 |
| Installation Labor | $500 (one-time) | $0 |
| Annual Data/Connectivity | $200-500 | $0 |
| Weekly Labor (52 weeks) | $0 | $2,600 (@2hrs/week) |
| 5-Year TCO | $4,500-8,000 | $13,200+ |
Ultimately, the “worth” of the data is tied to its ability to drive profitable and sustainable decisions. For time-critical operations like irrigation, the high-frequency data from wireless sensors provides a clear return on investment by optimizing inputs and protecting yield potential, a value proposition that a handheld probe’s weekly snapshots cannot match.
The Installation Mistake That Creates Air Gaps Around Sensors
The promise of high-accuracy data from a wireless sensor can be completely undermined by a single, common installation error: creating an air gap between the sensor probes and the soil. Soil moisture sensors work by measuring the dielectric properties of the surrounding medium. If that medium is air instead of soil, the readings will be wildly inaccurate. These air gaps act as channels for surface water to run down the probe after a rain event, causing a sudden, artificial spike in moisture readings that doesn’t reflect the actual soil matrix.
This problem most often occurs when the hole for the sensor is augered out and the sensor is simply dropped in and backfilled. The disturbed soil never fully settles back to its original bulk density, leaving micro-fissures. The correct method requires creating a pilot hole that is slightly smaller than the sensor probes and inserting the sensor with firm, consistent pressure to ensure perfect soil-to-sensor contact. This maintains the natural soil structure around the sensor, ensuring it measures the soil, not an anomaly of your own making. Studies show that even small air gaps around sensors can cause up to ±0.03 m³/m³ accuracy degradation, an error margin large enough to trigger a completely unnecessary irrigation cycle.

Detecting these issues after installation requires careful data analysis. Anomalous readings that don’t correlate with neighboring sensors or weather events are a major red flag. If you suspect an installation issue, a manual check with a handheld probe or gravimetric sample next to the sensor is the only way to verify its accuracy.
Your Action Plan: Troubleshooting Guide for Sensor Reading Anomalies
- Check for Spikes: Monitor for sudden, sharp increases in VWC readings immediately after rain, which indicate surface water infiltration through air gaps.
- Compare with Peers: Compare the anomalous sensor’s readings with those from nearby sensors. Isolated, erratic behavior often points to a localized installation issue.
- Perform a Manual Audit: Conduct a manual soil moisture check at the sensor’s depth using a handheld probe or the gravimetric method to establish a ground truth.
- Inspect for Settling: Visually inspect the soil surface around the probe. Visible gaps or soil settling are clear signs that reinstallation is required to ensure proper contact.
- Test Response Time: Observe the sensor’s reaction time to wetting and drying events. A delayed or muted response can signal poor soil contact.
When is the Soil Dry Enough for Heavy Machinery Traffic?
One of the most destructive—and costly—mistakes in farming is trafficking a field with heavy machinery when the soil is too wet. This leads to deep soil compaction, which crushes soil aggregates, reduces pore space, restricts root growth, and severely limits water infiltration and aeration for years to come. The question of “when is it dry enough?” is therefore a multi-thousand-dollar decision. This is another area where real-time soil moisture data provides a definitive, instrumented answer that goes beyond guesswork.
While handheld penetrometers can identify existing compaction (as we’ll see later), wireless sensors help prevent it from happening in the first place. The key is to establish a trafficability threshold based on soil moisture. As a general rule, many soil experts recommend that for fine-textured soils, the moisture level should be dried to below 60% of field capacity before heavy loads are applied. A wireless sensor network, with probes at tillage depth (e.g., 15-25 cm), provides the continuous data needed to know precisely when this threshold has been crossed.
This data-driven approach removes subjectivity and timing risks. Instead of relying on a calendar date or a visual inspection of the surface, a manager can wait for the data to confirm the subsoil is ready to bear the load. This is a prime example of using temporal data to make a critical operational decision. The SoilNet project, a long-term wireless sensor network, has produced over 50 million soil moisture measurements since 2009, providing an unparalleled dataset for making exactly these kinds of precise timing decisions to prevent compaction before it starts. This level of preventative insight is impossible with infrequent manual checks.
How to Map VRI Zones Based on Soil Water Holding Capacity?
Variable Rate Irrigation (VRI) represents one of the most advanced applications of precision agriculture, allowing a pivot to apply different amounts of water to different zones in a single pass. The goal is to match the application rate to the soil’s water-holding capacity (WHC). This is where the foundational EC map and the real-time sensor data converge. The EC map provides the static, high-resolution spatial blueprint of WHC variability, while a network of wireless sensors provides the dynamic, temporal data on how those zones are actually behaving.
Creating VRI maps is a multi-step process. First, the field is divided into management zones based on the initial EC survey or historical yield data. Then, at least one wireless sensor station (with probes at multiple depths) is installed in each representative zone. By monitoring these sensors, you can validate the zones and quantify their behavior. For example, you may find that a sandy zone (low EC) requires more frequent, lighter water applications, while a clay-loam zone (high EC) can be irrigated less frequently but with a larger volume. The high fidelity of modern wireless sensors can provide 99.5% accuracy with proper calibration, giving you confidence in these zone-specific prescriptions.
The real power comes from using the live sensor data to adjust the VRI program during the season. If a heatwave causes one zone to dry down faster than anticipated, the VRI prescription can be updated on the fly. This dynamic control, combining a high-resolution spatial map with high-resolution temporal data, is the pinnacle of water management. It ensures that every part of the field receives exactly the water it needs, when it needs it, maximizing water use efficiency and yield potential across the entire field.
How to Use a Penetrometer to Map Field Compaction Zones?
While wireless sensors are excellent for monitoring soil moisture to *prevent* compaction, the classic handheld tool for *identifying and mapping* existing compaction is the soil penetrometer. This instrument is fundamentally a calibrated pressure gauge (measured in PSI) attached to a metal rod with a cone tip. As you push the rod into the soil at a consistent rate, the dial shows the force required to penetrate the soil. A sudden spike in the PSI reading indicates a compacted layer, often called a hardpan or plow pan.
The strength of the penetrometer lies in its ability to quickly map spatial variability in soil density. By taking readings on a grid pattern across a field (e.g., every 100 feet), you can create a detailed map showing exactly where compaction zones are and at what depth they occur. This is a task for which a wireless sensor is unsuited; you need a mobile tool to gather many data points across a wide area. For the most accurate and comparable readings, soil moisture should be at or near field capacity, as dry soil will naturally give a higher PSI reading, potentially masking the true effect of compaction.
A reading above 300 PSI is generally considered restrictive to root growth for most crops. Once these zones are mapped, you can make targeted management decisions, such as deep ripping or subsoiling only in the affected areas, saving fuel and time. The penetrometer provides the “where,” allowing for a surgical rather than a broadcast approach to remediation. As a diagnostic tool, it is an indispensable part of a farmer’s toolkit, perfectly complementing the temporal monitoring of wireless sensors.
Precision agriculture optimizes resource use and minimizes waste, leading to significant environmental benefits, while precision irrigation enhances water use efficiency, conserving vital resources and protecting local ecosystems.
– Integration Research Team, Smart Sensors and IOT in Precision Agriculture Study
Key Takeaways
- The choice between wireless sensors and handheld probes is a strategic decision based on the agronomic question you need to answer (temporal vs. spatial variability).
- Total Cost of Ownership (TCO) analysis reveals that the high labor costs of manual checks often make wireless systems more economical in the long run.
- Data integrity is paramount. Proper installation of sensors to avoid air gaps and understanding how to read data in context are non-negotiable for success.
How to Interpret Soil Tests for Precision Fertilization?
The final piece of the soil monitoring puzzle is the traditional soil lab test. While sensors tell you about physical properties like moisture and probes reveal compaction, only a lab analysis can provide a detailed breakdown of the soil’s chemical properties: pH, organic matter, and the precise levels of macronutrients (N, P, K) and micronutrients. Interpreting these tests is the foundation of precision fertilization, ensuring you apply only what the crop needs, where it needs it. This is especially critical given that global agriculture accounts for 70% of freshwater withdrawals, making nutrient-use efficiency essential to protect water quality.
A soil test report should not be viewed in isolation. Its true power is unlocked when it is layered with the data from your other tools. For instance, your EC map can guide a zone-based sampling strategy, ensuring your samples accurately represent the different productive zones of your field. Your soil moisture sensor data can help you understand nutrient mobility; in waterlogged soils, for example, nitrogen is more likely to be lost through denitrification, a process that a soil test alone won’t reveal in real-time. An IoT-based system can achieve remarkable accuracy, with one study demonstrating 96.49% accuracy in water content prediction by combining sensor data with machine learning models trained on different soil types.
Ultimately, the most advanced approach integrates all three data streams. The lab test tells you what nutrients are present, the EC map shows you where the soil’s potential changes, and the wireless sensors tell you when conditions are optimal for nutrient uptake or at risk of nutrient loss. A handheld penetrometer confirms that there are no physical barriers preventing roots from accessing those nutrients. This holistic, data-layered approach is the essence of modern soil management, moving far beyond a simple choice between one tool and another.
The journey from data to decision begins not with a purchase, but with a question. Start by identifying the single biggest factor limiting your yield or driving your costs. By defining the problem with precision, you can select the instrument best suited to provide the answer and begin building a more resilient, profitable, and sustainable operation.